
Quantifying the Vibe: How to Use Sentiment Scores in Your Thesis
Every Portfolio Manager has had this argument with an analyst:
- Analyst A: "The CEO sounded confident about the guidance. I think they have visibility."
- Analyst B: "Really? To me, he sounded defensive. He kept dodging the margin question."
Who is right?
For decades, this was a debate that couldn't be settled. "Tone" and "Confidence" were subjective art forms. You relied on your gut, your experience, and your mood that morning.
But in modern finance, if you can't measure it, you can't model it.
Today, thanks to Natural Language Processing (NLP), we can finally quantify the "Vibe." We can turn the soft signals of human emotion into hard data points that fit into your risk framework.
Here is how to stop guessing the mood and start trading the Sentiment Score.
What is a Sentiment Score?
At its core, a Sentiment Score is a numerical representation of language positivity, negativity, and complexity.
Using Large Language Models (LLMs) trained on financial discourse, Nextmark analyzes every sentence in a transcript. It doesn't just count positive words (like "Great" or "Strong"); it analyzes the structure of the speech.
- Confidence: Short, direct sentences with active verbs.
- Hesitation: Passive voice, complex hedging, and filler words ("I mean," "Sort of," "To some extent").
- Net Score: A value typically ranging from -1.0 (Extreme Negative) to +1.0 (Extreme Positive).
This gives you an objective baseline. You no longer have to argue about whether the CEO sounded worried. The data says the Sentiment Score dropped from 0.65 last quarter to 0.15 this quarter. That is a measurable deterioration.
Strategy 1: The "Script vs. Reality" Gap (The Q&A Delta)
The single most valuable metric in sentiment analysis is the difference between the Prepared Remarks and the Q&A Session.
- The Script: Written by Investor Relations. Polished, optimistic, and safe.
- The Q&A: Unscripted, reactive, and revealing.
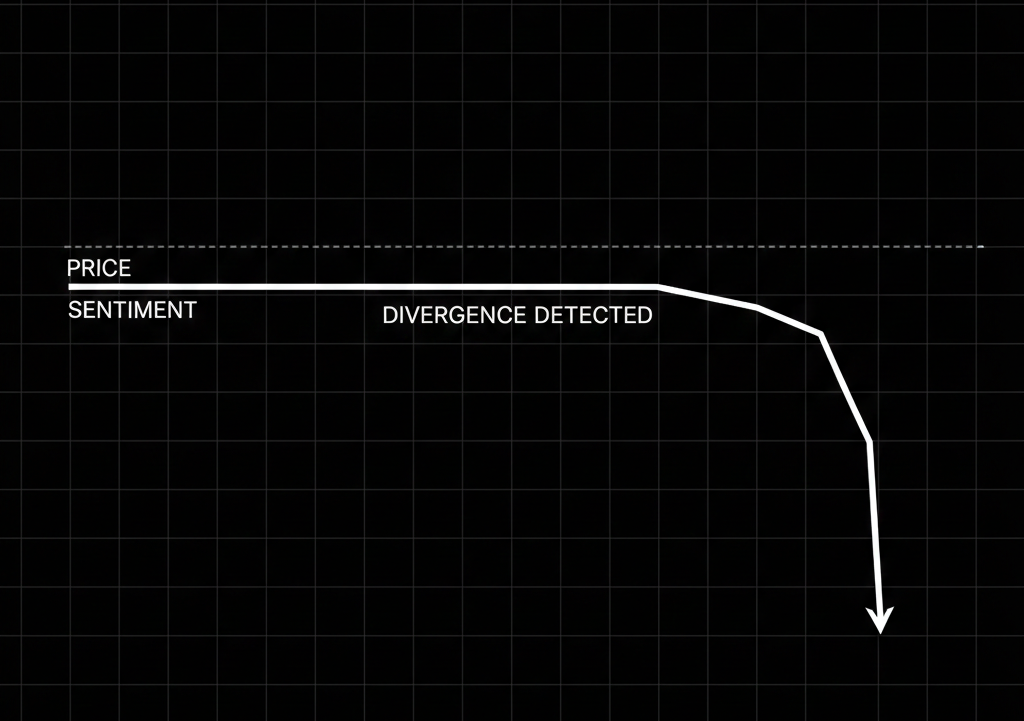
The Trade: Look for the "Negative Divergence."
If the Prepared Remarks score is High (+0.8) but the Q&A score drops to Low (+0.1 or Negative), the management team is trying to sell a story that cannot withstand scrutiny. They are optimistic when reading the teleprompter but defensive when answering questions.
This gap is often a leading indicator of a future guidance cut.
Strategy 2: Sentiment Momentum (The Trend)
Stock prices have momentum; so does language.
A single sentiment score in isolation is interesting, but the trend is actionable. You want to look at the Delta (Δ) over the last 4 quarters.
Consider a company where the stock price has drifted down 10% over the year, but the CEO’s Sentiment Score has steadily risen from 0.2 to 0.4 to 0.6.
- The Signal: Management is becoming more confident even as the market becomes more bearish.
- The Thesis: This is a potential dislocation. If the fundamental data supports it, this "Sentiment Divergence" suggests the bottom may be in, as insider confidence is recovering before the share price does.
Conversely, if the stock is at an all-time high but Sentiment is grinding lower quarter-over-quarter, management is quietly getting nervous.
Strategy 3: The "Peer Relative" View
Context matters. A Sentiment Score of 0.3 might look low, but if the entire sector is at -0.2, that company is actually a beacon of relative strength.
Use Sentiment Scores to benchmark a company against its direct competitors.
- Scenario: You are analyzing Home Builders. Rates are up, and the sector is crashing.
- The Data: Builder A has a sentiment score of -0.5 (Panic). Builder B has a sentiment score of 0.0 (Neutral).
- The Insight: Builder B is navigating the crisis better. While everyone is struggling, their "Neutral" tone indicates they have better hedging, better land banks, or better balance sheet strength than the panic at Builder A.
Conclusion: Data-Driven Conviction
"Gut feel" is not a strategy. It is a bias.
By integrating Sentiment Scores into your thesis, you add a layer of objective rigor to your qualitative research. You can backtest it, you can track it, and you can alert on it.
The next time an analyst tells you "The CEO sounded great," ask them: "What was the Q&A Delta?"
If they don't know, they aren't listening closely enough.
Measure the mood.
Nextmark provides institutional-grade Sentiment Analysis for every global earnings call, broken down by speaker and section.
Ready to see the magic happen? Register for a demo that actually respects your time. Our specialists are standing by to hook you up with platform access or get those API feeds flowing.
Qualitative Data Is the Edge. Start Using It.