
Integrating Textual Data into Quantitative Models
For fifty years, the wall between "Quantitative" and "Fundamental" investing was absolute.
Quants traded numbers: Price, Volume, P/E, EBITDA, Volatility.
Fundamentalists traded stories: Management quality, competitive moats, product roadmaps.
Quants largely ignored the "stories" because you cannot regress a PDF. You cannot calculate the standard deviation of an adjective. Text was considered "unstructured data"—messy, subjective, and computationally expensive.
But the Large Language Model (LLM) revolution has demolished that wall.
Today, text is numbers. We can now parse millions of documents, quantify their linguistic features, and feed them into systematic strategies just like any other factor.
For the modern Quant, the question is no longer "How do I read this?" It is "How do I weight this?" Here is how to integrate textual data into your quantitative framework.
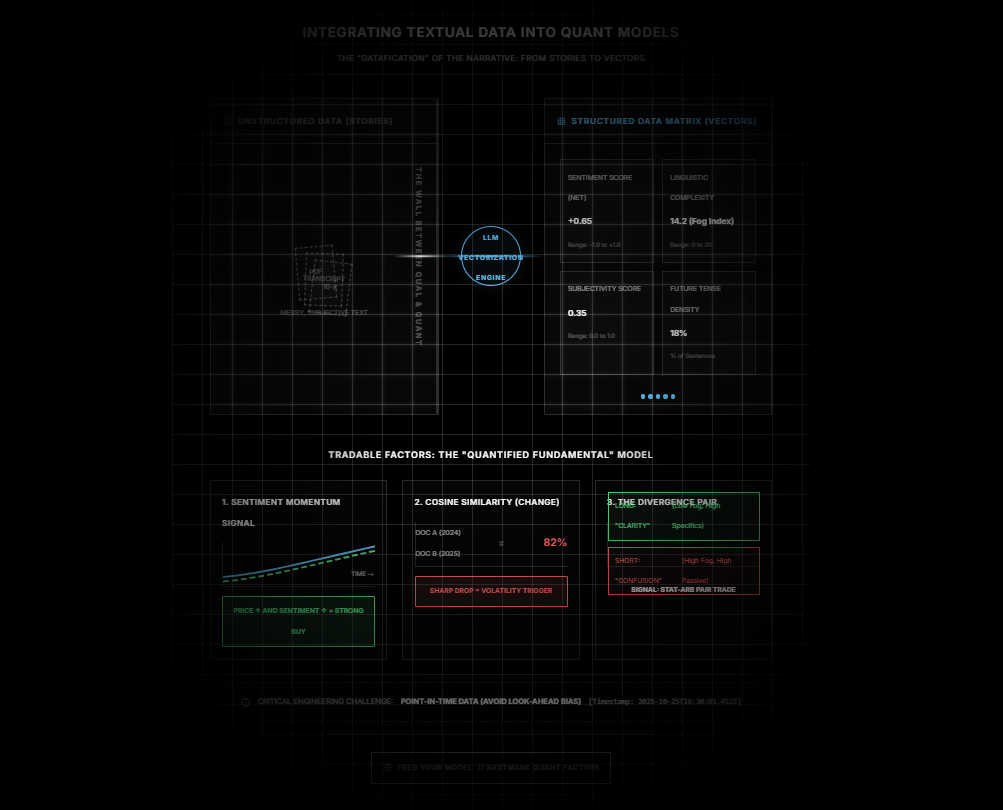
The "Datafication" of the Narrative
The first step in quantamental modeling is turning the "unstructured" into the "structured."
At Nextmark, we convert every earnings call, 10-K, and expert transcript into a time-series dataset. Instead of a stream of words, you get a matrix of vectors:
- Sentiment Score (Net): -1.0 to +1.0
- Linguistic Complexity (Fog Index): 0 to 20
- Subjectivity Score: 0.0 to 1.0
- Future Tense Density: % of sentences referencing the future.
Once text becomes a vector, it becomes tradable.
Factor 1: The "Sentiment Momentum" Signal
Most quants use Price Momentum (e.g., 12-month returns). A powerful enhancement to this is Sentiment Momentum.
A common strategy is the "Confirmation Signal."
- The Setup: You filter for stocks with top-decile Price Momentum (the stock is going up).
- The Filter: You overlay the 4-quarter Moving Average of Management Sentiment.
- The Signal:
- If Price is Up AND Sentiment is Up -> Strong Buy (The story supports the price).
- If Price is Up BUT Sentiment is Down -> False Breakout (Management is getting nervous while the market is getting greedy).
Backtests often show that filtering for "Sentiment Confirmation" significantly improves the Sharpe Ratio of standard momentum strategies by reducing drawdowns.
Factor 2: Cosine Similarity (The "Change" Factor)
Risk models love stability. Textual analysis offers a unique way to measure stability called Cosine Similarity.
This measures how similar Document A is to Document B.
- High Similarity (98%): The company copy-pasted last year's 10-K. The business is stable/stagnant.
- Low Similarity (80%): The company rewrote large sections of the "Risk Factors" or "MD&A."
The Alpha Signal: A sharp drop in Cosine Similarity (year-over-year) is a massive volatility predictor.
If a boring utility company suddenly rewrites 20% of its 10-K, something material has changed—a lawsuit, a regulatory shift, or a business pivot. Quantitative models can use this "Similarity Drop" as a trigger to cut position sizing or increase volatility assumptions.
Factor 3: The "Divergence" Pair Trade
For statistical arbitrage (StatArb) desks, textual data offers a new way to find pairs.
Instead of just pairing stocks in the same sector (e.g., Long GM / Short Ford), you can pair stocks with Diverging Narrative Realities.
- Long Leg: Companies with "High Certainty" language (Low Fog Index, High Specifics Ratio).
- Short Leg: Companies with "Low Certainty" language (High Fog Index, High Passive Voice).
You are essentially longing "Clarity" and shorting "Confusion." Over long time horizons, clarity tends to outperform confusion because it correlates with better management execution.
The Engineering Challenge: Point-in-Time Data
A critical warning for quants: Look-Ahead Bias.
When backtesting textual signals, you must ensure you are using Point-in-Time timestamps.
You cannot trade on the Sentiment Score of the 10-K based on the "Filing Date" if the market didn't digest it until the "Publication Time."
Nextmark’s API is built for backtesting. We stamp every sentiment score with the exact millisecond the text became public. This ensures your model trades on the reality of the moment, not the benefit of hindsight.
The Future is Hybrid
The best models of the next decade won't be "Pure Quant" or "Pure Fundamental." They will be Quantified Fundamental.
They will take the nuance of the story—the hesitation, the change, the excitement—and give it a coefficient.
Don't leave the narrative on the table just because it didn't come in a CSV file. Structure it, model it, and trade it.
Feed your model.
Nextmark provides clean, Point-in-Time historical APIs for Sentiment, Similarity, and Linguistic Factors dating back 15 years.
Ready to see the magic happen? Register for a demo that actually respects your time. Our specialists are standing by to hook you up with platform access or get those API feeds flowing.
Qualitative Data Is the Edge. Start Using It.